Received: Thu 15, May 2025
Accepted: Tue 03, Jun 2025
Abstract
Background: Intracerebral hemorrhage (ICH), accounting for 10-15% of strokes, is linked to high mortality and severe disability, burdening patients, families, and society. Key modifiable risk factors include dietary habits and metabolic abnormalities. Dietary risks, such as excessive sodium intake, inadequate potassium consumption, and insufficient intake of fruits, vegetables, and whole grains, along with components of metabolic syndrome, including hypertension, dyslipidemia, and insulin resistance, are strongly linked to ICH. This study uses Global Burden of Disease data to assess ICH burden and its trends, guiding prevention strategies globally.
Method: This study utilizes data from the GBD 2021 database to analyze the global burden of ICH attributable to dietary and metabolic risks, focusing on deaths and disability-adjusted life years (DALYs). Descriptive analyses evaluate variations across genders, age groups, regions, and SDI classifications. Trends from 1990 to 2021 are assessed using estimated annual percentage change (EAPC). Future projections are made using the Auto-Regressive Integrated Moving Average (ARIMA) model and exponential smoothing (ES) models.
Result: In 2021, there were 494,132 deaths and 12,745,155 DALYs due to ICH linked to dietary risks, increasing from 1990, but with declining ASMR and ASDR (EAPC: -1.68 and -1.83, respectively). For metabolic risks, deaths rose to 2,137,048 and DALYs to 50,331,952, while ASMR and ASDR decreased (EAPC: -0.71 and -0.82). Males exhibited higher ASMR and ASDR than females. Age-specific burdens peaked in older groups, with a rising trend in young adults for metabolic risks. Low-SDI regions had the highest burden. Projections suggest stable or slightly increasing deaths and DALYs, but declining ASMR and ASDR until 2050.
Conclusion: despite reductions in age-standardized ICH rates, the burden remains significant. Efforts should focus on mitigating modifiable risks in high-burden regions. Future research must evaluate interventions to guide global prevention strategies.
Keywords
Intracerebral hemorrhage, dietary risks, metabolic risks, Global Burden of Disease
1. Introduction
Stroke remains a leading cause of mortality and morbidity worldwide, with intracerebral hemorrhage (ICH) representing approximately 10-15% of all stroke cases [1, 2]. ICH, characterized by bleeding within the brain parenchyma, often leads to severe neurological deficits and long-term disability [3]. ICH is associated with higher case-fatality rates compared to ischemic stroke [4]. Survivors often face lifelong disabilities, including physical impairments, cognitive deficits, and emotional disturbances, imposing a profound burden on patients, their families, and society [5, 6]. The economic repercussions are equally staggering, encompassing direct medical expenses for acute care, rehabilitation, and long-term management, as well as indirect costs related to lost productivity and caregiver burden [5, 7].
Dietary factors have garnered increasing attention as modifiable contributors to ICH risk. Excessive sodium intake, a hallmark of many modern diets, is closely linked to hypertension, the most well-established risk factor for ICH [8, 9]. High sodium consumption disrupts vascular homeostasis, promoting endothelial dysfunction and vascular remodeling, thereby increasing the likelihood of cerebral hemorrhage [10]. Conversely, insufficient potassium intake, often seen in tandem with high sodium consumption, exacerbates this risk by impairing vascular tone regulation [11-13]. Moreover, diets rich in processed meats, which contain nitrates and nitrites, have been associated with an elevated ICH risk [14, 15]. These compounds may induce endothelial damage and oxidative stress, compromising vascular integrity [16, 17]. Similarly, excessive intake of trans fats, commonly found in fried foods and commercially baked goods, contributes to inflammation and endothelial dysfunction, further potentiating hemorrhagic risk [18]. On the other hand, inadequate consumption of fruits, vegetables, and whole grains deprives the body of essential antioxidants, fiber, and phytonutrients that support vascular health [19]. These dietary deficiencies may lead to increased oxidative stress, endothelial dysfunction, and impaired blood pressure regulation, all of which are implicated in ICH pathogenesis [20, 21].
Metabolic syndrome, a constellation of abnormalities including hypertension, dyslipidemia, insulin resistance, and abdominal obesity, significantly heightens the risk of ICH [22-24]. Each component of this syndrome interacts synergistically to promote a prothrombotic and proinflammatory state, fostering vascular damage and hemorrhagic events [25]. Hypertension, the cornerstone of metabolic syndrome, directly weakens cerebral vascular walls, leading to microaneurysms and vascular fragility [26]. Dyslipidemia, characterized by elevated low-density lipoprotein cholesterol and reduced high-density lipoprotein cholesterol, promotes atherosclerosis and plaque instability, increasing the susceptibility to vascular rupture. Insulin resistance, often preceding type 2 diabetes, induces endothelial dysfunction and oxidative stress, further compromising vascular integrity [27, 28]. Diabetes mellitus itself amplifies ICH risk through multiple mechanisms. Chronic hyperglycemia leads to advanced glycation end-product formation, which damages vascular collagen and elastin, reducing vessel wall strength [29, 30]. Additionally, diabetes is associated with impaired fibrinolysis and platelet dysfunction, potentially exacerbating hemorrhage severity once a vascular rupture occurs [31].
While hypertension has long been recognized as a primary risk factor for ICH, emerging evidence suggests that dietary patterns and metabolic abnormalities also play crucial roles in the pathogenesis of this condition [22, 32, 33]. This study aims to comprehensively evaluate the global, regional, and national burden of ICH attributable to dietary and metabolic risks from 1990 to 2021, with forecasts extending to 2050. By leveraging the robust methodology of the Global Burden of Disease (GBD) study, this research seeks to quantify the impact of these modifiable risk factors on ICH incidence, mortality, and disability-adjusted life-years (DALYs). The findings will inform the development of targeted public health strategies aimed at reducing the burden of ICH through dietary modifications and metabolic risk factor control.
2. Method
2.1. Data Source
GBD 2021 study (Link) comprehensively gathers and analyzes up-to-date global disease burden data on 371 diseases and injuries, while also estimating the associations between 88 risk factors and health outcomes [34, 35]. The data on deaths, disability-adjusted life years (DALYs), years lived with disability (YLDs) and years of life lost (YLLs) of ICH attributable to dietary and metabolic risks used in this study were all obtained from the GBD 2021 database. In this study, the deaths and DALYs are used as the main descriptive indicators.
2.2. Descriptive Analysis
In this study, we examined the distribution characteristics of the burden of ICH attributable to dietary and metabolic risks globally and across different genders, age groups, regions and countries in 1990 and 2021. In GBD 2021 study, the formula for ASR calculation is as follows:
\[A S R=\frac{\sum_{i=1}^A a_i w_i}{\sum_{i=1}^A w_i} \times 100,000\]
Where i denotes the ith age group, ai represents age-specific rate, wi is the number of population (or weight) in the corresponding age groups of the selected reference standard population [36]. In this study, the ASR is measured per 100,000 people.
Uncertainty intervals (UIs) were estimated based on the 2.5th and 97.5th percentiles derived from a 1000-draw distribution for each metric [37]. Countries and territories in the GBD 2021 dataset are classified into five groups according to their Sociodemographic Index (SDI) scores: low (< 0.46), low-middle (0.46-0.60), middle (0.61-0.69), high-middle (0.70-0.81), and high (> 0.81) [38]. All analyses were conducted using R software (version 4.1.0), with statistical significance defined as a P-value below 0.05.
2.3. Trend Analysis
The average trends in age-standardized mortality rate (ASMR), age-standardized DALYs rate (ASDR), age-standardized YLDs rate (ASYR) and age-standardized YLLs rate during 1990 to 2021 are assessed using the estimated annual percentage change (EAPC). The formula for calculating EAPC is as follows:
\[\begin{gathered}y=\alpha+\beta x+\varepsilon \\ E A P C=\left(e^\beta-1\right) \times 100 \%\end{gathered}\]
Where y represents ln(ASR), x denotes the calendar year and β is the slope obtained from the linear regression of the natural logarithm of the ASR on the year [39].
2.4. Analysis for Health Inequality
Health inequalities are defined as measurable health disparities between population subgroups based on social, economic, geographic, or demographic factors [40]. The slope index and concentration index, which are standard metrics for absolute and relative disparities, were used to evaluate the health disparities of deaths, DALYs, YLDs and YLLs caused by ICH attributable to dietary and metabolic risks [41]. Weighted regression analysis across all age groups is used to calculate the slope index against a relative positional measure associated with the SDI, which is the midpoint of the population's cumulative range when ranked by SDI [42]. Using the cumulative relative population distribution based on SDI and the relative cumulative scores, the area beneath the Lorenz concentration curve is computed numerically to determine the concentration index [43].
2.5. Forecasting Analysis
In this study, the projections for the burden of ICH attributable to dietary and metabolic risks performed using the exponential smoothing (ES) model and the autoregressive integrated moving average (ARIMA) model. The ARIMA model is particularly effective in capturing trends and seasonal patterns in data, while the ES model prioritizes recent observations, providing a comprehensive outlook on potential future developments [44].
3. Results
3.1. Global Burden
In 2021, there were 494132 (95% UI: 176420-910628) deaths due to ICH attributable to dietary risks, increased from 434013 (95% UI: 229170-704181) in 1990. And ICH attributable to dietary risks caused 12745155 (95% UI: 4643556-22891812) in 2021, increased from 12005155 (95% UI: 6759508-18848389) in 1990 (Tables 1 & 2).
TABLE 1: The
deaths and age-standardized mortality rate (ASMR) of intracerebral hemorrhage attributable
to dietary risks in 1990 and 2021.
|
|
1990 |
2021 |
EAPC
(95% CI) |
||
|
|
number
(95% UI) |
ASR (95%
UI) |
number
(95% UI) |
ASR (95%
UI) |
|
|
Global |
434013
(229170-704181) |
11.03
(5.67-18.19) |
494132
(176420-910628) |
5.73
(2.01-10.61) |
-1.68 (-1.94--1.43) |
|
sex |
|
|
|
|
|
|
Female |
186358
(94174-318609) |
8.79
(4.39-15.1) |
190928
(63708-367231) |
4.13
(1.39-7.93) |
-2.66
(-2.8--2.52) |
|
Male |
247655
(129348-394477) |
13.76
(6.93-22.36) |
303204
(105678-546434) |
7.59
(2.56-13.89) |
-2.1
(-2.26--1.95) |
|
age |
|
|
|
|
|
|
25-29
years |
2715
(1406-4456) |
0.61
(0.32-1.01) |
1831
(438-3193) |
0.31
(0.07-0.54) |
-2.61
(-2.81--2.42) |
|
30-34
years |
4633
(2502-7432) |
1.2
(0.65-1.93) |
3672
(219-6684) |
0.61
(0.04-1.11) |
-2.43
(-2.56--2.29) |
|
35-39
years |
8229
(3966-13381) |
2.34
(1.13-3.8) |
6364 (263-11352) |
1.13
(0.05-2.02) |
-2.44
(-2.57--2.31) |
|
40-44
years |
13226
(6985-21257) |
4.62
(2.44-7.42) |
11743
(3279-19942) |
2.35
(0.66-3.99) |
-2.34
(-2.45--2.22) |
|
45-49
years |
20724
(12577-32429) |
8.93
(5.42-13.97) |
20674
(6631-35267) |
4.37
(1.4-7.45) |
-2.32 (-2.41--2.23) |
|
50-54
years |
35195
(20350-54339) |
16.56
(9.57-25.56) |
33855
(12199-58169) |
7.61
(2.74-13.07) |
-2.71
(-2.84--2.58) |
|
55-59
years |
51118
(28148-79336) |
27.6
(15.2-42.84) |
52168
(17747-90339) |
13.18
(4.48-22.83) |
-2.61
(-2.72--2.51) |
|
60-64
years |
63009
(33900-99568) |
39.23
(21.11-61.99) |
61240
(25193-106096) |
19.13
(7.87-33.15) |
-2.5
(-2.62--2.38) |
|
65-69
years |
74650
(37735-121469) |
60.39
(30.53-98.27) |
86735
(34842-149597) |
31.44
(12.63-54.23) |
-2.33
(-2.53--2.14) |
|
70-74
years |
62824 (31005-105089) |
74.21
(36.62-124.13) |
73093
(22211-135181) |
35.51
(10.79-65.67) |
-2.48
(-2.66--2.29) |
|
75-79
years |
52807
(22501-93092) |
85.79
(36.55-151.23) |
62089
(16314-122897) |
47.08
(12.37-93.19) |
-2.25
(-2.41--2.09) |
|
80-84
years |
26833
(8772-52841) |
75.85 (24.8-149.37) |
38273
(6082-84721) |
43.7
(6.94-96.73) |
-1.98
(-2.16--1.8) |
|
85-89
years |
13505
(3900-26526) |
89.37
(25.81-175.54) |
27918
(3213-61381) |
61.06
(7.03-134.25) |
-1.5
(-1.81--1.19) |
|
90-94
years |
3807
(1176-8012) |
88.83
(27.44-186.96) |
11491 (895-25886) |
64.23
(5-144.7) |
-1.14
(-1.31--0.97) |
|
95+
years |
739
(216-1610) |
72.62
(21.18-158.11) |
2986
(-20-7369) |
54.78
(-0.37-135.2) |
-0.94
(-1.02--0.86) |
|
SDI
region |
|
|
|
|
|
|
Low SDI |
38055
(9783-63608) |
16.92
(4.29-28.88) |
51017
(12579-88258) |
10.09 (2.29-18.1) |
-1.81
(-1.89--1.73) |
|
Low-middle
SDI |
89592
(27638-145829) |
14.6
(4.36-23.99) |
123304
(38737-208748) |
8.6
(2.63-14.79) |
-1.79
(-1.84--1.74) |
|
Middle
SDI |
181339
(93946-293347) |
18.63
(9.16-30.95) |
209270
(39638-404734) |
8.01
(1.44-15.69) |
-2.85 (-3.01--2.7) |
|
High-middle
SDI |
101898
(23239-188083) |
10.53
(2.41-19.55) |
93498
(-20090-209735) |
4.7
(-1.12-10.65) |
-2.99
(-3.34--2.65) |
|
High SDI |
22694
(-8919-55537) |
2.03
(-0.86-5.01) |
16675
(-14062-49674) |
0.74
(-0.78-2.27) |
-3.5
(-3.6--3.39) |
TABLE 2: The DALYs
and age-standardized DALYs rate (ASDR) of intracerebral hemorrhage attributable
to dietary risks in 1990 and 2021.
|
|
1990 |
2021 |
EAPC
(95% CI) |
||
|
|
number
(95% UI) |
ASR (95%
UI) |
number
(95% UI) |
ASR (95%
UI) |
|
|
Global |
12005155
(6759508-18848389) |
288.73
(159.65-456.84) |
12745155
(4643556-22891812) |
145.88
(52.8-262.44) |
-1.83
(-2.03--1.62) |
|
sex |
|
|
|
|
|
|
Female |
4984802
(2727317-8259213) |
229.38
(124.64-381.02) |
4755615
(1747041-8687543) |
104.37
(38.54-190.22) |
-2.77
(-2.9--2.64) |
|
Male |
7020353
(3866166-10977142) |
355.62
(190.1-560.47) |
7989540
(2919172-14081339) |
191.34
(68.32-338.84) |
-2.17
(-2.31--2.03) |
|
age |
|
|
|
|
|
|
25-29
years |
184514
(92206-303571) |
41.69
(20.83-68.59) |
124596
(25454-220969) |
21.18
(4.33-37.56) |
-2.63
(-2.82--2.44) |
|
30-34 years |
284695
(150778-456720) |
73.87
(39.12-118.5) |
225710
(4103-413116) |
37.34
(0.68-68.34) |
-2.44
(-2.57--2.31) |
|
35-39
years |
457942
(216899-748067) |
130.01
(61.58-212.37) |
355768
(8901-644955) |
63.43
(1.59-114.99) |
-2.44
(-2.57--2.31) |
|
40-44
years |
659652 (343201-1060048) |
230.26
(119.8-370.02) |
588410
(156298-1001770) |
117.62
(31.24-200.25) |
-2.33
(-2.44--2.22) |
|
45-49
years |
925145
(556594-1448238) |
398.43
(239.71-623.71) |
928835
(294026-1583173) |
196.16
(62.1-334.35) |
-2.31
(-2.4--2.22) |
|
50-54
years |
1387772 (801434-2150210) |
652.85
(377.02-1011.52) |
1345184
(476922-2309651) |
302.34
(107.19-519.11) |
-2.69
(-2.82--2.56) |
|
55-59
years |
1759074
(969828-2721433) |
949.82
(523.67-1469.46) |
1809548
(608839-3148389) |
457.27
(153.85-795.59) |
-2.59
(-2.7--2.48) |
|
60-64
years |
1857142
(996476-2938618) |
1156.31
(620.44-1829.67) |
1816804
(737866-3153642) |
567.67
(230.55-985.37) |
-2.48
(-2.6--2.36) |
|
65-69
years |
1842565
(930449-2999739) |
1490.63
(752.73-2426.79) |
2153322
(865149-3719389) |
780.64
(313.64-1348.38) |
-2.31 (-2.51--2.12) |
|
70-74
years |
1273587
(629582-2138249) |
1504.33
(743.65-2525.66) |
1492091
(452185-2754999) |
724.88
(219.68-1338.42) |
-2.46
(-2.65--2.28) |
|
75-79
years |
855722
(365513-1507919) |
1390.16
(593.79-2449.69) |
1010203
(264781-2003842) |
765.98 (200.77-1519.39) |
-2.25
(-2.4--2.09) |
|
80-84
years |
341053
(111616-672091) |
964.08
(315.52-1899.85) |
486961
(77807-1076740) |
556
(88.84-1229.39) |
-1.97
(-2.15--1.79) |
|
85-89
years |
136617
(39387-268954) |
904.08
(260.65-1779.85) |
281568
(32637-617890) |
615.83 (71.38-1351.41) |
-1.51
(-1.81--1.2) |
|
90-94
years |
33496
(10303-70205) |
781.68
(240.43-1638.33) |
101259
(7820-228684) |
566.03
(43.71-1278.32) |
-1.14
(-1.3--0.97) |
|
95+
years |
6180
(1790-13539) |
607
(175.85-1329.8) |
24895
(-212-61410) |
456.77 (-3.9-1126.72) |
-0.96
(-1.04--0.88) |
|
SDI
region |
|
|
|
|
|
|
Low SDI |
1141608
(280860-1870441) |
450.41
(114.04-747.57) |
1536227
(399518-2556036) |
265.91
(67.56-453.8) |
-1.87
(-1.96--1.79) |
|
Low-middle
SDI |
2720015
(826979-4314981) |
397.88
(122.22-639.36) |
3523238 (1161867-5762480) |
227.5
(73.54-377.59) |
-1.88
(-1.92--1.83) |
|
Middle
SDI |
4983865
(2735041-7830007) |
454.6
(241.6-729.37) |
5185973
(937869-9776052) |
187.1
(32.95-354.48) |
-2.99
(-3.14--2.85) |
|
High-middle
SDI |
2620593
(447154-4870180) |
257.94 (45.51-479.36) |
2157540
(-666475-5059864) |
108.67
(-39.53-258.39) |
-3.16
(-3.5--2.83) |
|
High SDI |
527823
(-349132-1382096) |
48.55
(-34.5-129.28) |
332808
(-474733-1091419) |
16.48
(-29.87-57.88) |
-3.71
(-3.82--3.6) |
TABLE 3: The
deaths and age-standardized mortality rate (ASMR) of intracerebral hemorrhage
attributable to metabolic risks in 1990 and 2021.
|
|
1990 |
2021 |
EAPC
(95% CI) |
||
|
|
number
(95% UI) |
ASR (95%
UI) |
number
(95% UI) |
ASR (95%
UI) |
|
|
Global |
1395849 (1109180-1656549) |
37.08
(29.54-44.05) |
2137048
(1723175-2528845) |
25.13
(20.3-29.81) |
-0.71
(-1.01--0.42) |
|
sex |
|
|
|
|
|
|
Female |
693002
(555266-825093) |
33.45
(26.71-39.83) |
973518
(784567-1193200) |
20.96
(16.89-25.7) |
-1.69
(-1.85--1.52) |
|
Male |
702847 (538328-845022) |
41.35
(31.67-49.56) |
1163530
(908718-1394307) |
30.02
(23.41-36.12) |
-1.15
(-1.32--0.97) |
|
age |
|
|
|
|
|
|
20-24
years |
-48
(-184-179) |
-0.01
(-0.04-0.04) |
240
(-12-696) |
0.04
(0-0.12) |
12.15
(9.4-14.97) |
|
25-29
years |
5148
(3355-7424) |
1.16 (0.76-1.68) |
5417
(3696-7486) |
0.92
(0.63-1.27) |
-0.76
(-0.9--0.62) |
|
30-34
years |
9093
(6351-12100) |
2.36
(1.65-3.14) |
11619
(8243-15629) |
1.92
(1.36-2.59) |
-0.68
(-0.82--0.53) |
|
35-39
years |
16572
(11725-21600) |
4.7
(3.33-6.13) |
20411
(15093-25483) |
3.64 (2.69-4.54) |
-0.86
(-1.03--0.68) |
|
40-44
years |
29353
(21277-36951) |
10.25
(7.43-12.9) |
38987
(29666-47966) |
7.79
(5.93-9.59) |
-0.94
(-1.11--0.77) |
|
45-49
years |
48460
(36246-60056) |
20.87
(15.61-25.86) |
69077
(53414-84405) |
14.59
(11.28-17.83) |
-1.12 (-1.26--0.98) |
|
50-54
years |
91474
(70790-112515) |
43.03
(33.3-52.93) |
123210
(97395-147762) |
27.69
(21.89-33.21) |
-1.51
(-1.63--1.38) |
|
55-59
years |
136129
(106351-162752) |
73.5
(57.42-87.88) |
183100
(145294-218446) |
46.27
(36.72-55.2) |
-1.68 (-1.77--1.58) |
|
60-64
years |
180344
(143084-214526) |
112.29
(89.09-133.57) |
225136
(179417-263308) |
70.34
(56.06-82.27) |
-1.71
(-1.84--1.57) |
|
65-69
years |
218218
(173406-257623) |
176.54
(140.29-208.42) |
313882
(250679-373538) |
113.79
(90.88-135.42) |
-1.67 (-1.88--1.47) |
|
70-74
years |
209213
(165280-253192) |
247.12
(195.22-299.07) |
311458
(246201-376268) |
151.31
(119.61-182.8) |
-1.67
(-1.87--1.47) |
|
75-79
years |
217172
(170208-262723) |
352.81
(276.51-426.81) |
309058
(245278-374189) |
234.34 (185.98-283.73) |
-1.5
(-1.66--1.33) |
|
80-84
years |
133490
(100540-163934) |
377.35
(284.2-463.41) |
241682
(182383-294313) |
275.95
(208.24-336.04) |
-1.11
(-1.31--0.91) |
|
85-89
years |
73593
(54275-90613) |
487.01
(359.17-599.65) |
181726
(137382-229807) |
397.46 (300.47-502.62) |
-0.81
(-1.11--0.52) |
|
90-94
years |
22570
(16609-27743) |
526.7
(387.59-647.41) |
79347
(56724-99786) |
443.54
(317.08-557.8) |
-0.58
(-0.76--0.4) |
|
95+
years |
5066
(3703-6424) |
497.63
(363.77-631.01) |
22697
(15896-29489) |
416.44 (291.65-541.05) |
-0.6
(-0.65--0.54) |
|
SDI
region |
|
|
|
|
|
|
Low SDI |
107022
(82509-131935) |
51.39
(39.46-63.19) |
172777
(134678-211344) |
36.73
(28.43-45.07) |
-1.15
(-1.21--1.08) |
|
Low-middle
SDI |
253376
(199671-305313) |
44.73
(35.37-53.82) |
457591 (367481-538789) |
33.37
(26.67-39.36) |
-0.99
(-1.05--0.93) |
|
Middle
SDI |
496399
(388509-612481) |
55.2
(42.7-68.2) |
894550
(707586-1075733) |
35.61
(28.08-42.96) |
-1.44
(-1.64--1.24) |
|
High-middle
SDI |
381728
(304807-457388) |
41.17
(32.86-49.29) |
469128 (360826-571885) |
23.94
(18.43-29.22) |
-2.11
(-2.46--1.77) |
|
High SDI |
155686
(126535-180301) |
13.95
(11.32-16.16) |
141319
(111508-169214) |
6.28
(5-7.47) |
-2.83
(-2.95--2.71) |
TABLE 4: The DALYs
and age-standardized DALYs rate (ASDR) of intracerebral hemorrhage attributable
to metabolic risks in 1990 and 2021.
|
|
1990 |
2021 |
EAPC
(95% CI) |
||
|
|
number
(95% UI) |
ASR (95%
UI) |
number
(95% UI) |
ASR (95%
UI) |
|
|
Global |
34963180
(27769762-41578391) |
866.2
(687.36-1030.29) |
50331952
(40288092-59299298) |
580.2
(464.54-683.84) |
-0.82
(-1.06--0.59) |
|
sex |
|
|
|
|
|
|
Female |
16334592
(12980892-19492656) |
763.38
(608.07-910.6) |
21516723
(17657891-26410843) |
468.8
(385.58-575.57) |
-1.76 (-1.92--1.61) |
|
Male |
18628588
(14300845-22509057) |
979.33
(750.4-1180.23) |
28815230
(22542450-34425812) |
701.83
(548.16-838.82) |
-1.18
(-1.34--1.02) |
|
age |
|
|
|
|
|
|
20-24
years |
-3600
(-13714-13443) |
-0.73
(-2.79-2.73) |
18310
(-872-51961) |
3.07
(-0.15-8.7) |
11.68 (9.16-14.26) |
|
25-29
years |
352249
(229876-506675) |
79.58
(51.94-114.47) |
374957
(253467-518838) |
63.73
(43.08-88.19) |
-0.73
(-0.87--0.6) |
|
30-34
years |
561996
(390376-742338) |
145.81
(101.29-192.6) |
724389
(515525-974385) |
119.84
(85.28-161.19) |
-0.66 (-0.8--0.52) |
|
35-39
years |
925636
(654742-1208653) |
262.78
(185.88-343.13) |
1150219
(860604-1428850) |
205.08
(153.44-254.76) |
-0.84
(-1.01--0.67) |
|
40-44
years |
1469384
(1059236-1847455) |
512.91
(369.74-644.88) |
1962799
(1485677-2415164) |
392.36 (296.99-482.79) |
-0.93
(-1.09--0.76) |
|
45-49
years |
2166485
(1621682-2670768) |
933.04
(698.41-1150.22) |
3111710
(2412959-3804168) |
657.17
(509.6-803.41) |
-1.11
(-1.25--0.96) |
|
50-54
years |
3614925
(2810317-4442277) |
1700.57
(1322.06-2089.78) |
4904611 (3884388-5872576) |
1102.35
(873.05-1319.91) |
-1.48
(-1.61--1.35) |
|
55-59
years |
4689891
(3669978-5615891) |
2532.34
(1981.63-3032.34) |
6359876
(5047081-7564760) |
1607.13
(1275.39-1911.61) |
-1.65
(-1.75--1.56) |
|
60-64
years |
5324278
(4230058-6331420) |
3315.05 (2633.76-3942.13) |
6692383
(5332567-7797544) |
2091.06
(1666.18-2436.37) |
-1.68
(-1.81--1.55) |
|
65-69
years |
5397052
(4290351-6383931) |
4366.21
(3470.89-5164.6) |
7808122
(6241539-9276342) |
2830.65
(2262.72-3362.92) |
-1.65
(-1.85--1.45) |
|
70-74
years |
4250582
(3365821-5140499) |
5020.7
(3975.64-6071.85) |
6374264
(5056640-7645404) |
3096.72
(2456.6-3714.26) |
-1.65
(-1.85--1.46) |
|
75-79
years |
3523056
(2759199-4262444) |
5723.38
(4482.46-6924.55) |
5036660
(3994732-6075072) |
3819
(3028.97-4606.36) |
-1.49
(-1.65--1.32) |
|
80-84
years |
1701182
(1278832-2087323) |
4808.87
(3614.98-5900.41) |
3081559
(2335879-3743923) |
3518.44
(2667.04-4274.71) |
-1.11
(-1.3--0.91) |
|
85-89
years |
747452
(553599-920376) |
4946.39
(3663.53-6090.74) |
1839813
(1393815-2319243) |
4023.93
(3048.47-5072.51) |
-0.82 (-1.11--0.53) |
|
90-94
years |
199879
(147488-245095) |
4664.42
(3441.8-5719.58) |
702130
(501608-884016) |
3924.84
(2803.94-4941.57) |
-0.58
(-0.76--0.41) |
|
95+
years |
42731
(31388-53791) |
4197.2
(3083.09-5283.51) |
190153
(134291-246312) |
3488.85 (2463.91-4519.24) |
-0.63
(-0.69--0.57) |
|
SDI
region |
|
|
|
|
|
|
Low SDI |
2937828
(2255785-3617380) |
1236.23
(953.72-1525.51) |
4736676
(3719675-5862737) |
878.11
(686.95-1074.47) |
-1.2
(-1.27--1.14) |
|
Low-middle
SDI |
6908531
(5404742-8370439) |
1079.98 (851.15-1302.79) |
11991099
(9720051-14153927) |
801.54
(647.45-944.27) |
-0.99
(-1.06--0.93) |
|
Middle
SDI |
12516124
(9813820-15481170) |
1207.27
(943.04-1487.02) |
20649243
(16326495-24785072) |
763.9
(604.15-918.62) |
-1.5
(-1.68--1.32) |
|
High-middle
SDI |
9034489 (7178712-10874584) |
908.79
(725.19-1093.67) |
10076340
(7775936-12315104) |
515.93
(397.76-630.99) |
-2.19
(-2.53--1.86) |
|
High SDI |
3525880
(2861963-4092626) |
323.91
(263.08-375.79) |
2837426
(2266752-3338982) |
144.36
(114.89-169.86) |
-2.87
(-2.99--2.76) |
From 1990 to 2021, the ASMR of ICH attributable to dietary risks decreased from 11.03 (95% UI: 5.67-18.19) in 1990 to 5.73 (95% UI: 2.01-10.61) in 2021, with an EAPC of -1.68 (95% CI: -1.94-1.43). And the ASDR decreased from 288.73 (95% UI: 159.65-456.84) in 1990 to 145.88 (95% UI: 52.8-262.44) in 2021, with an EAPC of -1.83 (95% CI: -2.03-1.62) (Figure 1A). In 2021, there were 2137048 (95% UI: 1723175-2528845) deaths due to ICH attributable to metabolic risks, increased from 1395849 (95% UI: 1109180-1656549) in 1990. And ICH attributable to metabolic risks caused 50331952 (95% UI: 40288092-59299298) in 2021, increased from 34963180 (95% UI: 27769762-41578391) in 1990 (Tables 3 & 4).
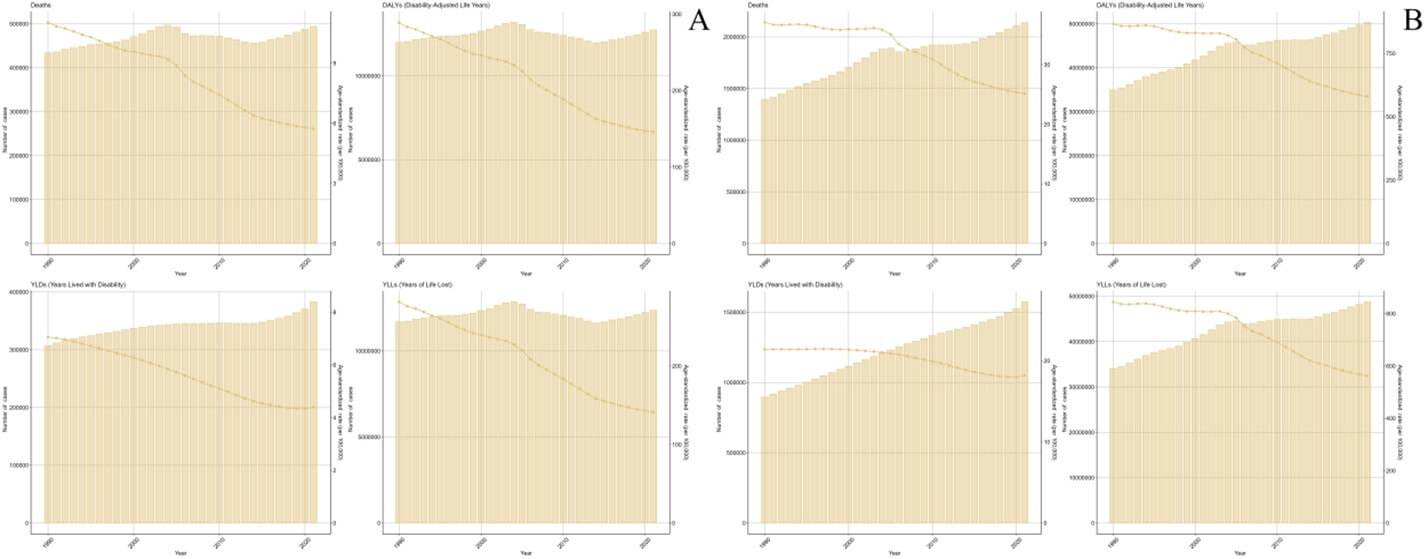
From 1990 to 2021, the ASMR of ICH attributable to metabolic risks decreased from 37.08 (95% UI: 29.54-44.05) in 1990 to 25.13 (95% UI: 20.3-29.81) in 2021, with an EAPC of -0.71 (95% CI: -1.01-0.42). And the ASDR decreased from 866.2 (95% UI: 687.36-1030.29) in 1990 to 580.2 (95% UI: 464.54-683.84) in 2021, with an EAPC of -0.82 (95% CI: -1.06-0.59) (Figure 1B).
3.2. Sex-Specific Burden
In 2021, the ASMR and ASDR of ICH attributable to dietary risks for males were higher than those for females (Figure S1A). The deaths, DALYs, YLDs and YLLs of ICH attributable to dietary risks by sex in 2021 are depicted in (Figure S2A).
From 1990 to 2021, the ASMR of ICH attributable to dietary risks for females decreased from 8.79 (95% UI: 4.39-15.1) in 1990 to 4.13 (95% UI: 1.39-7.93) in 2021, with an EAPC of -2.66 (95% CI: -2.8-2.52). And the ASMR for males decreased from 13.76 (95% UI: 6.93-22.36) in 1990 to 7.59 (95% UI: 2.56-13.89) in 2021, with an EAPC of -2.1 (95% CI: -2.26-1.95). Additionally, from 1990 to 2021, the ASDR of ICH attributable to dietary risks for females decreased from 229.38 (95% UI: 124.64-381.02) in 1990 to 104.37 (95% UI: 38.54-190.22) in 2021, with an EAPC of -2.77 (-95% CI: 2.9-2.64). And the ASDR for males decreased from 355.62 (95% UI: 190.1-560.47) in 1990 to 191.34 (95% UI: 68.32-338.84) in 2021, with an EAPC of -2.17 (95% CI: -2.31-2.03) (Figure S3A). Trends in the deaths, DALYs, YLDs and YLLs of ICH attributable to dietary risks by sex from 1990 to 2021 are depicted in (Figure S4A).
In 2021, the ASMR and ASDR of ICH attributable to metabolic risks for males were higher than those for females (Figure S1B). The deaths, DALYs, YLDs and YLLs of ICH attributable to metabolic risks by sex in 2021 are depicted in (Figure S2B). From 1990 to 2021, the ASMR of ICH attributable to metabolic risks for females decreased from 33.45 (95% UI: 26.71-39.83) in 1990 to 20.96 (95% UI: 16.89-25.7) in 2021, with an EAPC of -1.69 (95% CI: -1.85-1.52). And the ASMR for males decreased from 41.35 (95% UI: 31.67-49.56) in 1990 to 30.02 (95% UI: 23.41-36.12) in 2021, with an EAPC of -1.15 (95% CI: -1.32-0.97). Additionally, from 1990 to 2021, the ASDR of ICH attributable to metabolic risks for females decreased from 763.38 (95% UI: 608.07-910.6) in 1990 to 468.8 (95% UI: 385.58-575.57) in 2021, with an EAPC of -1.76 (95% CI: -1.92-1.61). And the ASDR for males decreased from 979.33 (95% UI: 750.4-1180.23) in 1990 to 701.83 (95% UI: 548.16-838.82) in 2021, with an EAPC of -1.18 (95% CI: -1.34-1.02) (Figure S3B). Trends in the deaths, DALYs, YLDs and YLLs of ICH attributable to metabolic risks by sex from 1990 to 2021 are depicted in (Figure S4B).
3.3. Age-Specific Burden
In 2021, the highest ASMR of ICH attributable to dietary risks was observed in 90-94 age group [64.23 (95% UI: 5-144.7)]. And the highest ASDR was observed in 65-69 age group [780.64 (95% UI: 313.64-1348.38)] (Figure S5A).
The deaths, DALYs, YLDs and YLLs of ICH attributable to dietary risks by age in 2021 are depicted in (Figure S6A). From 1990 to 2021, the ASMR of ICH attributable to dietary risks in all age groups decreased, with the fastest decline occurred in 50-54 age group (EAPC = -2.71, 95% CI: -2.84-2.58). The ASDR of ICH attributable to dietary risks in all age groups decreased during the same period, with the fastest decline occurred in 50-54 age group (EAPC = -2.69, 95% CI: -2.82-2.56) (Figure S7A). Trends in the deaths, DALYs, YLDs and YLLs of ICH attributable to dietary risks by age from 1990 to 2021 are depicted in (Figure S8A).
In 2021, the highest ASMR of ICH attributable to metabolic risks was observed in 90-94 age group [443.54 (95% UI: 317.08-557.8)]. And the highest ASDR was observed in 85-89 age group [4023.93 (95% UI: 3048.47-5072.51)] (Figure S5B). The deaths, DALYs, YLDs and YLLs of ICH attributable to metabolic risks by age in 2021 are depicted in (Figure S6B). From 1990 to 2021, the ASMR of ICH attributable to metabolic risks only in 20-24 age groups increased, with an EAPC of 12.15 (95% CI: 9.4-14.97). The ASDR of ICH attributable to metabolic risks only in 20-24 age groups increased during the same period, with an EAPC of 11.68 (95% CI: 9.16-14.26) (Figure S7B). Trends in the deaths, DALYs, YLDs and YLLs of ICH attributable to metabolic risks by age from 1990 to 2021 are depicted in (Figure S8B).
3.4. Regional and National Burden
In 2021, the ASMR and ASDR of ICH attributable to dietary risks is negatively correlated the SDI of the corresponding region, with the highest ASMR and ASDR observed in low SDI region [ASMR: 10.09 (95% UI: 2.29-18.1), ASDR: 265.91 (95% UI: 67.56-453.8)] (Figure S9A). The deaths, DALYs, YLDs and YLLs of ICH attributable to dietary risks by SDI region in 2021 are depicted in (Figure S10A). From 1990 to 2021, the ASMR of ICH attributable to dietary risks in all SDI regions decreased, with the fastest decline occurred in high SDI region (EAPC = -3.5, 95% CI: -3.6-3.39). The ASDR of ICH attributable to dietary risks in all SDI regions decreased during the same period, with the fastest decline occurred in high SDI region (EAPC = -3.71, 95% CI: -3.82-3.6) (Figure S11A). Trends in the deaths, DALYs, YLDs and YLLs of ICH attributable to dietary risks by SDI region from 1990 to 2021 are depicted in (Figure S12A).
In 2021, the ASMR and ASDR of ICH attributable to metabolic risks are negatively correlated the SDI of the corresponding region, with the highest ASMR and ASDR observed in low SDI region [ASMR: 36.73 (95% UI: 28.43-45.07), ASDR: 878.11 (95% UI: 686.95-1074.47)] (Figure S9B). The deaths, DALYs, YLDs and YLLs of ICH attributable to metabolic risks by SDI region in 2021 are depicted in (Figure S10B). From 1990 to 2021, the ASMR of ICH attributable to metabolic risks in all SDI regions decreased, with the fastest decline occurred in high SDI region (EAPC = -2.83, 95% CI: -2.95-2.71). The ASDR of ICH attributable to metabolic risks in all SDI regions decreased during the same period, with the fastest decline occurred in high SDI region (EAPC = -2.87, 95% CI: -2.99-2.76) (Figure S11B). Trends in the deaths, DALYs, YLDs and YLLs of ICH attributable to metabolic risks by SDI region from 1990 to 2021 are depicted in (Figure S12B).
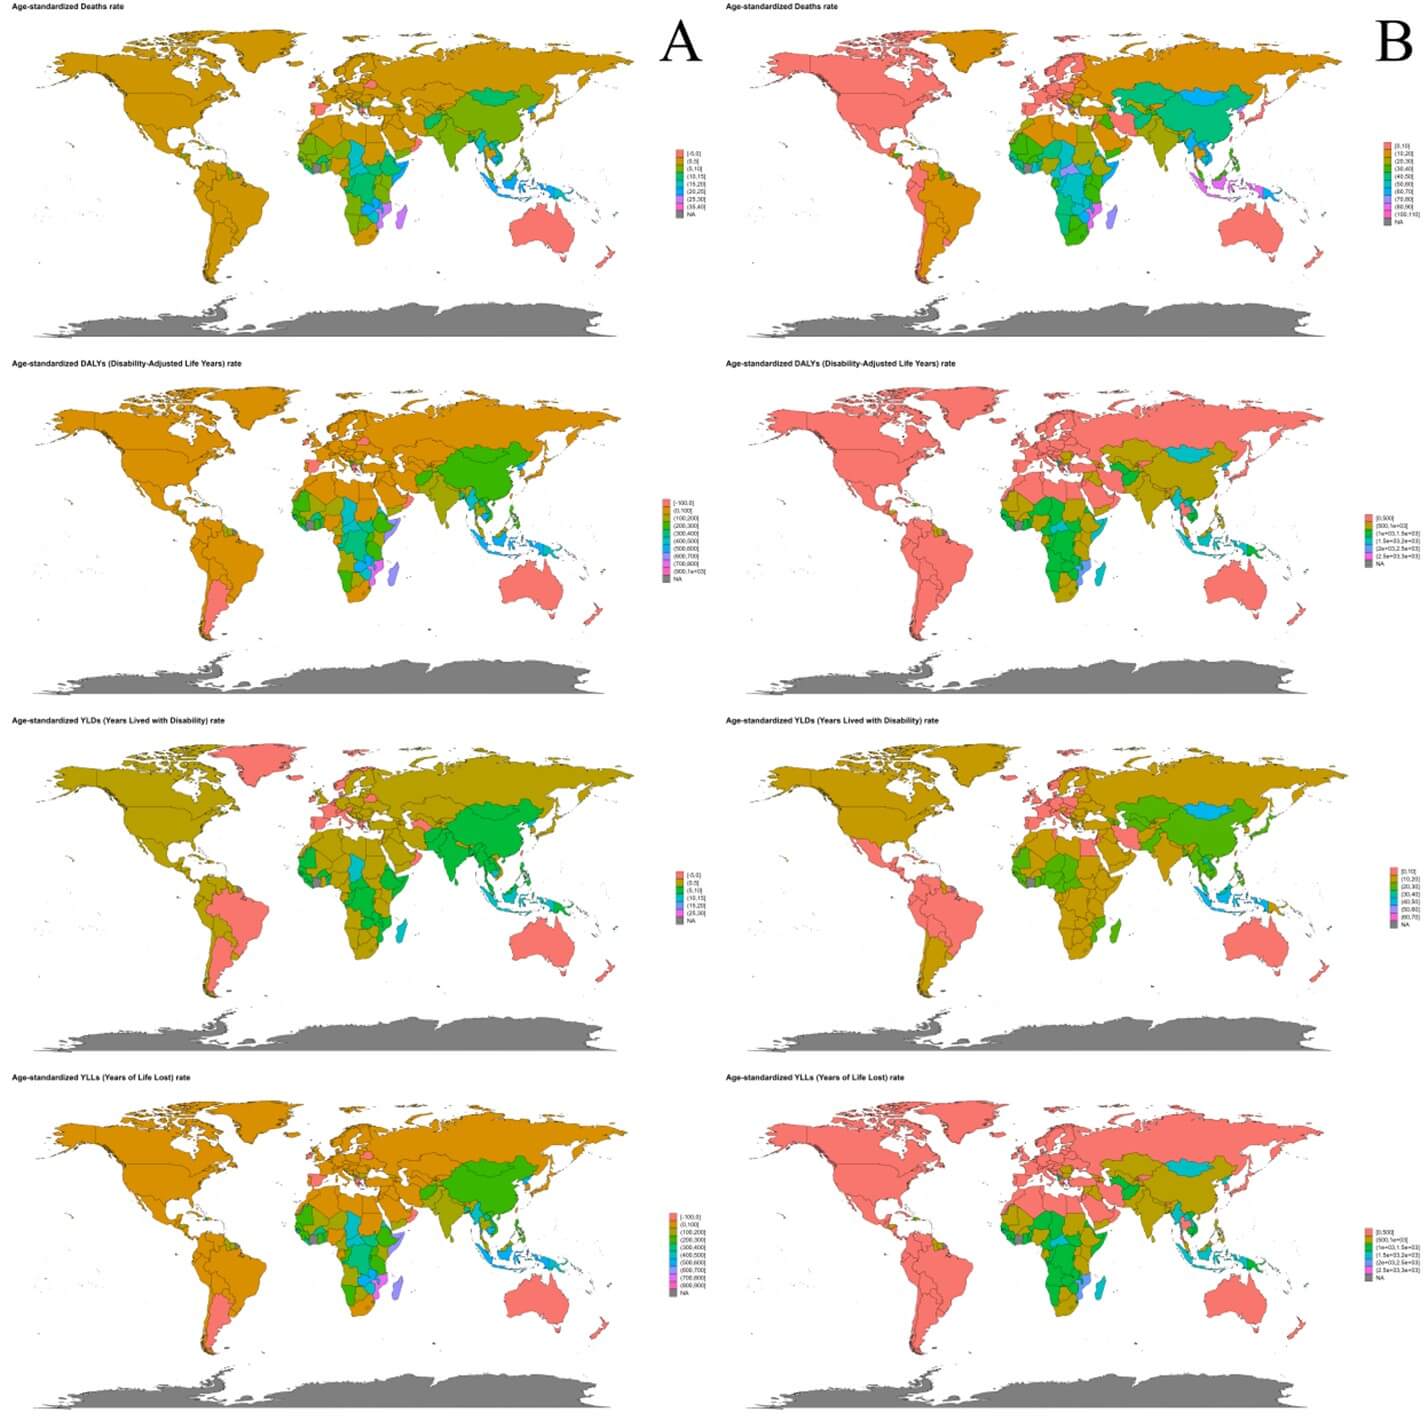
In 2021, the three countries with highest ASMR of ICH attributable to dietary risks were Solomon Islands [36.68 (95% UI: 11.24-65)], Mozambique [28.66 (95% UI: 4.69-50.84)] and Madagascar [26.1 (95% UI: 6.7-47.73)]. And the three countries with highest ASDR of ICH attributable to dietary risks were Solomon Islands [924.31 (95% UI: 250.25-1588.9)], Mozambique [764.61 (95% UI: 131.46-1317.38)] and Madagascar [683.65 (95% UI: 182.74-1214.56)] (Figure 2A).
World map of the deaths, DALYs, YLDs and YLLs of ICH attributable to dietary risks in 2021 is depicted in (Figure S13A). From 1990 to 2021, the fastest growth of ASMR of ICH attributable to dietary risks occurred in Oman (EAPC = 5.13, 95% CI: 3.08-7.23), Qatar (EAPC = 5.01, 95% CI: 1.82-8.29) and United States of America (EAPC = 3.59, 95% CI: 2.84-4.34). The fastest growth of ASDR of ICH attributable to dietary risks occurred in United States of America (EAPC = 10.97, 95% CI: 8.86-13.12), United Arab Emirates (EAPC = 9.6, 95% CI: 7.52-11.73) and Bermuda (EAPC = 5.52, 95% CI: 3.58-7.5) (Figure 3A).
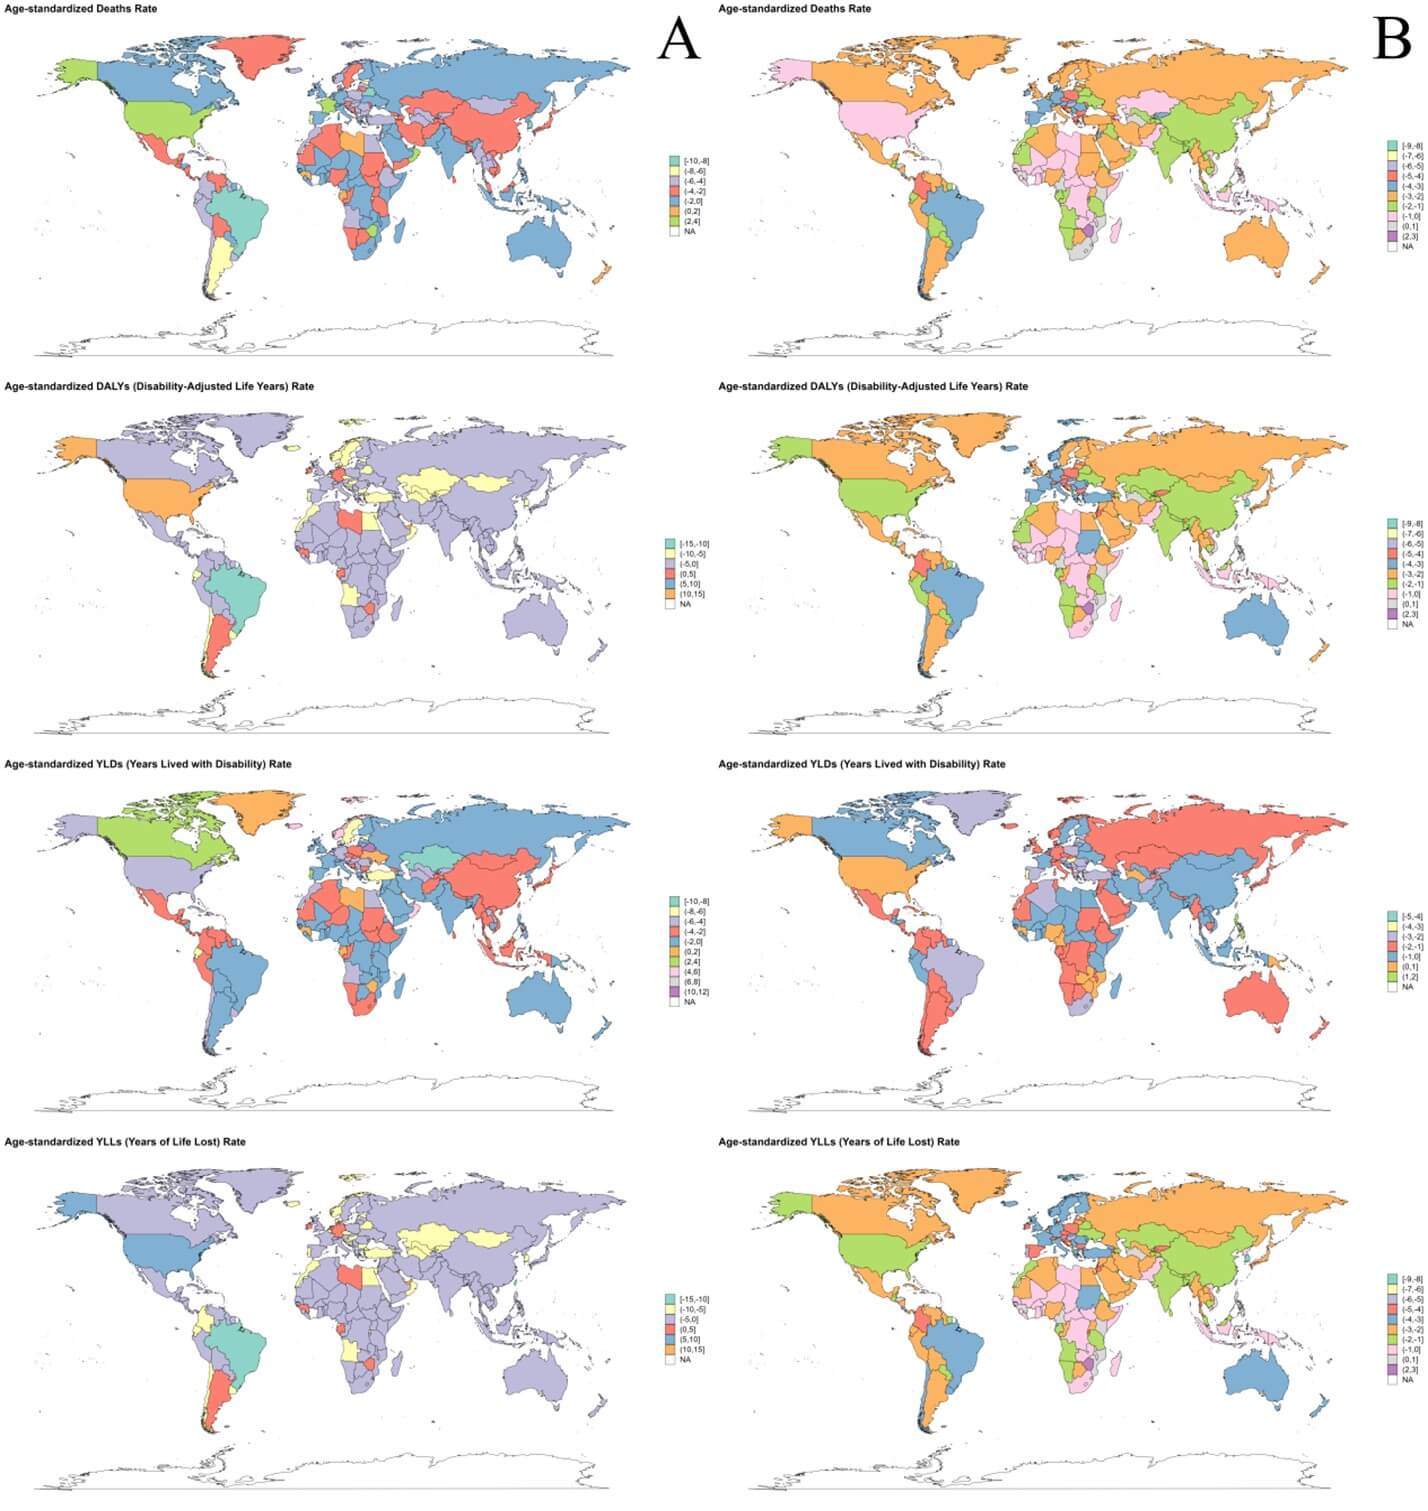
In 2021, the three countries with highest ASMR of ICH attributable to metabolic risks were Montenegro [108.94 (95% UI: 84.55-133.93)], Nauru [103.23 (95% UI: 76.53-133.72)] and Solomon Islands [87.94 (95% UI: 65.25-118.13)]. And the three countries with highest ASDR of ICH attributable to metabolic risks were Philippines [989.15 (95% UI: 752.18-1232.1)], Sao Tome and Principe [981.53 (95% UI: 742.88-1255.66)] and Bangladesh [974.11 (95% UI: 698.74-1292.95)] (Figure 2B). World map of the deaths, DALYs, YLDs and YLLs of ICH attributable to metabolic risks in 2021 is depicted in (Figure S13B). From 1990 to 2021, the fastest growth of ASMR of ICH attributable to metabolic risks occurred in Zimbabwe (EAPC = 2.35, 95% CI: 0.93-3.8), Lesotho (EAPC=2.07, 95% CI: 1.13-3.03) and Turkmenistan (EAPC = 1.42, 95% CI: 0.59-2.25). The fastest growth of ASDR of ICH attributable to metabolic risks occurred in Zimbabwe (EAPC = 2.7, 95% CI: 1.42-4), Lesotho (EAPC = 2.46, 95% CI: 1.63-3.29) and Turkmenistan (EAPC = 1.44, 95% CI: 0.74-2.15) (Figure 3B).
3.5. Analysis for Health Inequality
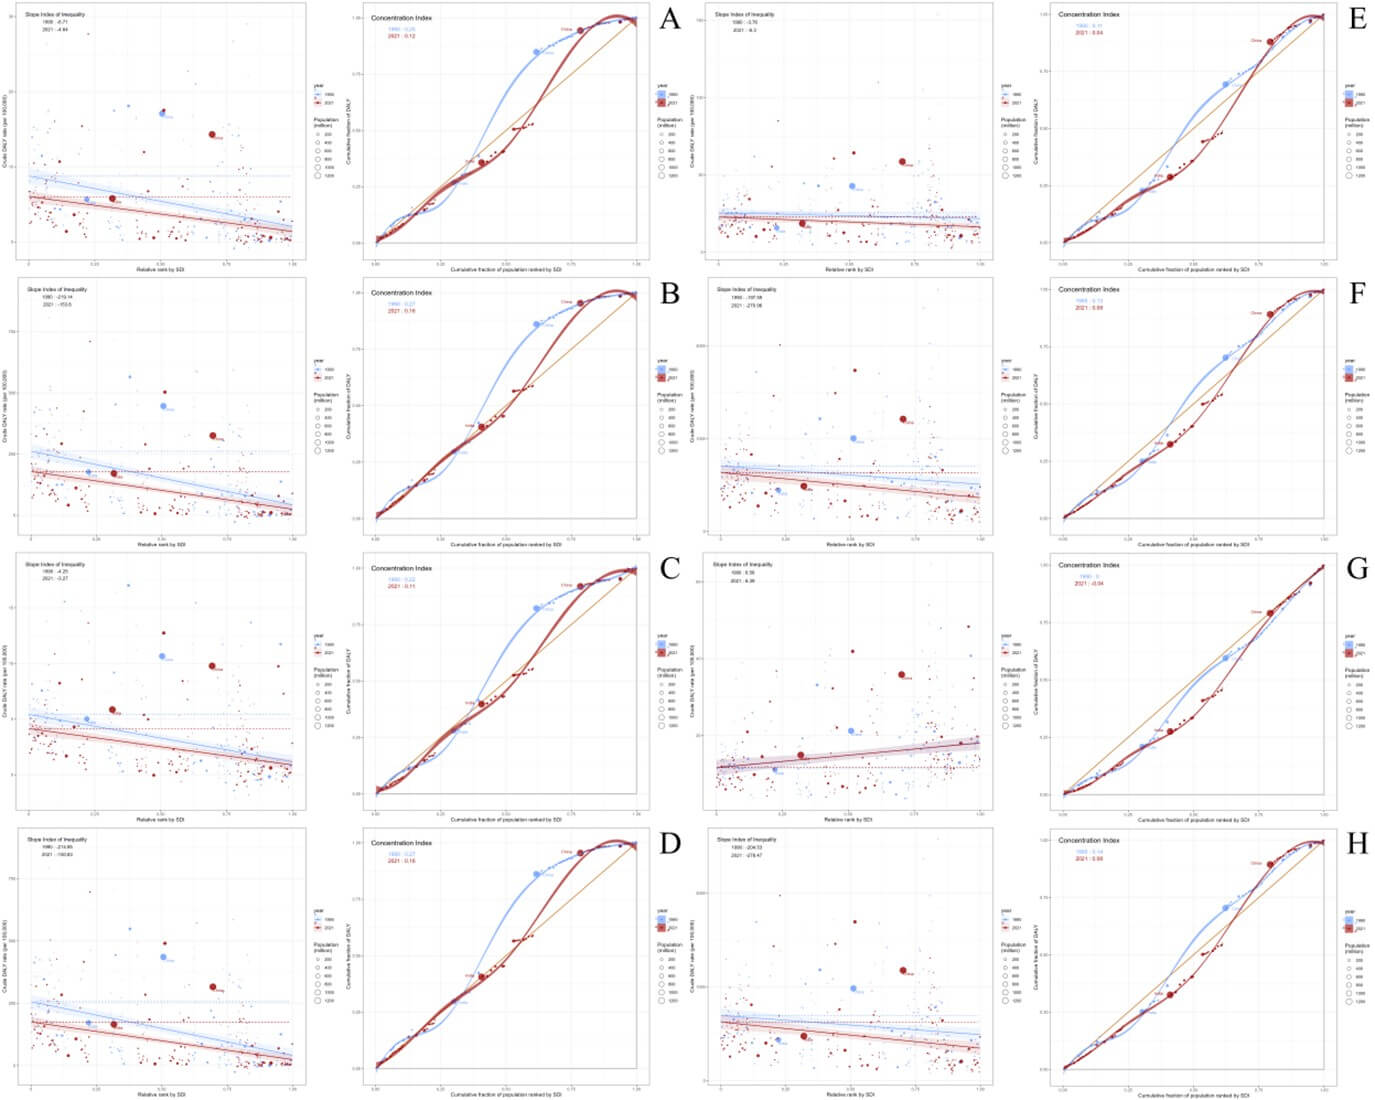
From 1990 to 2021, the slope index of inequality (SII) for ASMR of ICH attributable to dietary risks changed from -6.71 in 1990 to -4.64 in 2021. The concentration index for ASMR changed from 0.25 in 1990 to 0.12 in 2021 (Figure 4A). The SII for ASDR of ICH attributable to dietary risks changed from -219.14 in 1990 to -153.8 in 2021. The concentration index for ASDR changed from 0.27 in 1990 to 0.16 in 2021 (Figure 4B). From 1990 to 2021, the SII for ASMR of ICH attributable to metabolic risks changed from -3.76 in 1990 to -6.3 in 2021. The concentration index for ASMR changed from 0.11 in 1990 to 0.04 in 2021 (Figure 4E). The SII for ASDR of ICH attributable to metabolic risks increased from -157.59 in 1990 to -270.96 in 2021. The concentration index for ASDR changed from 0.13 in 1990 to 0.08 in 2021 (Figure 4F).
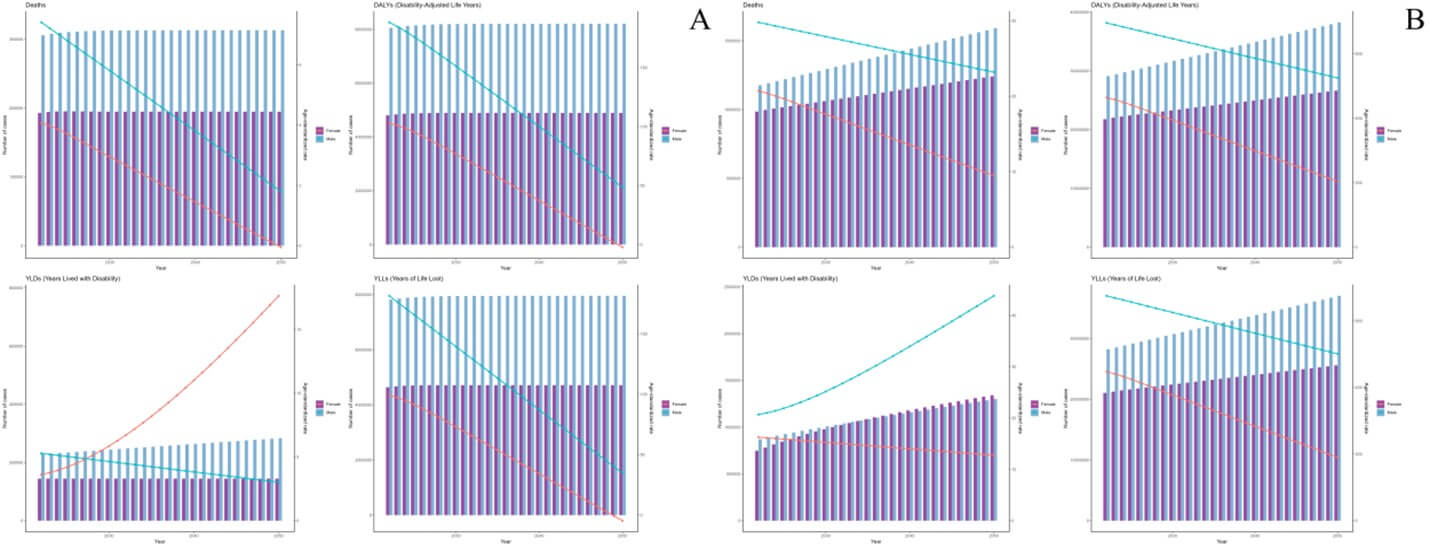
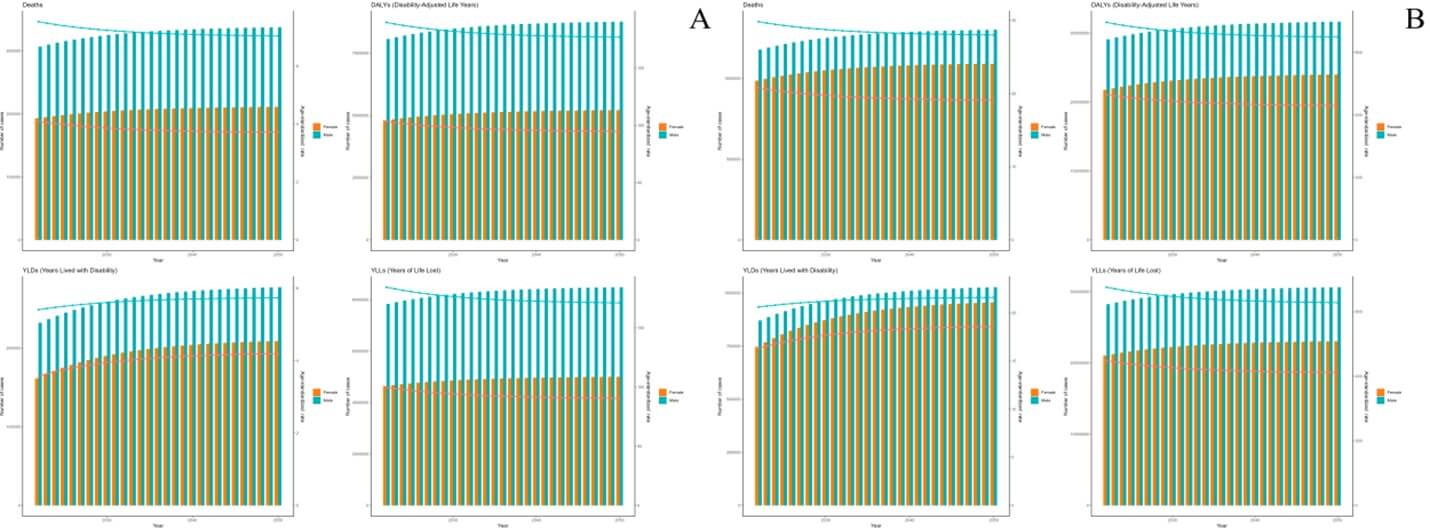
3.6. Projections to 2050
As projected by the ARIMA model, the deaths and DALYs of ICH attributable to dietary risks are expected to remain stable, while those of ICH attributable to metabolic risks are expected to increase from 2022 to 2050. And the ASMR and ASDR of ICH attributable to dietary and metabolic risks are expected to decrease linearly during 2022 to 2050 (Figure 5). As projected by the ES model, the deaths and DALYs of ICH attributable to dietary and metabolic risks are expected to increased slightly from 2022 to 2050. And the ASMR and ASDR of ICH attributable to dietary and metabolic risks are expected to decrease slightly during 2022 to 2050 (Figure 6).
4. Discussion
The Global Burden of Disease (GBD) Study 2021 provides a comprehensive analysis of the burden of intracerebral hemorrhage (ICH) attributable to dietary and metabolic risks across different regions, age groups, and sexes from 1990 to 2021 [45]. The findings reveal significant trends and disparities that warrant attention, highlighting both progress and persistent challenges. The findings reveal a complex interplay between demographic shifts, risk factor dynamics, and public health interventions.
In 2021, dietary risks accounted for 494,132 deaths due to ICH, an increase from 434,013 in 1990. However, the age-standardized mortality rate (ASMR) declined from 11.03 to 5.73 per 100,000, and the age-standardized disability-adjusted life years (DALYs) rate (ASDR) decreased from 288.73 to 145.88 over the same period. For metabolic risks, the death toll rose sharply from 1,395,849 in 1990 to 2,137,048 in 2021, yet ASMR fell from 37.08 to 25.13, and ASDR from 866.2 to 580.2. These divergent trends- rising absolute numbers alongside declining standardized rates- underscore the dual forces of population growth and aging against the backdrop of improved prevention and management strategies. While the global burden of ICH remains substantial, the reductions in ASMR and ASDR reflect advancements in healthcare access, risk factor awareness, and policy-driven interventions [46]. However, the persistence of high burdens in specific regions, age groups, and demographics signals unmet needs and calls for targeted action [47, 48].
The gender disparities observed in ICH burden are striking. In 2021, males exhibited higher ASMR and ASDR for both dietary and metabolic risks compared to females. This pattern persisted despite declines in rates for both sexes since 1990. While both sexes experienced declines in these rates from 1990 to 2021, the slower reduction among males for dietary-related ICH suggests underlying biological and behavioral factors. Biological differences, such as hormonal influences on vascular health, may partially explain this gap. Estrogen’s protective role in premenopausal women, for instance, is well-documented in cardiovascular disease literature, potentially extending to ICH risk [49, 50]. Behaviorally, higher rates of smoking, alcohol consumption, and salt intake among males- particularly in low- and middle-income countries (LMICs)- likely exacerbate dietary risks [51, 52]. Additionally, occupational exposures and delayed healthcare-seeking behavior in males may contribute to poorer outcomes [53]. The smaller decline in male ASMR/ASDR for dietary risks underscores the need for gender-tailored interventions, such as public health campaigns addressing male-specific risk behaviors and improving access to preventive care in underserved communities [54]. Addressing these disparities requires tailored interventions considering gender-specific risk profiles.
Age-specific patterns further illuminate the burden dynamics. For dietary risks, the highest ASMR in 2021 occurred in the 90-94 age group, while ASDR peaked earlier at 65-69 years. This discrepancy suggests that while mortality concentrates in the oldest populations, the disability burden disproportionately affects younger seniors, likely due to longer survival with chronic sequelae of ICH [55]. Metabolic risks showed a similar ASMR peak in the 90-94 age group but a later ASDR peak at 85-89 years, reflecting the compounding effects of aging on metabolic dysregulation and post-ICH disability. Notably, while most age groups experienced declining ASMR and ASDR for both risk categories, the 20-24 age group saw a significant rise in metabolic risk-related ICH. This alarming trend aligns with global increases in early-onset obesity, hypertension, and diabetes, driven by sedentary lifestyles, processed food consumption, and socioeconomic stressors [22, 56, 57]. The rise in young adults signals a looming crisis, as early metabolic dysfunction predisposes individuals to lifelong cardiovascular risks, necessitating urgent interventions targeting adolescents and young adults [58].
Geographic disparities remain profound. The inverse correlation between Socio-demographic Index (SDI) and ASMR/ASDR for both dietary and metabolic risks highlights the disproportionate burden borne by low-SDI regions. In 2021, countries like Solomon Islands, Mozambique, and Madagascar topped the rankings for dietary risk-related ASMR and ASDR, reflecting limited access to nutritious foods, high salt intake, and inadequate hypertension management [59, 60]. Similarly, Montenegro, Nauru, and Solomon Islands led in metabolic risk-related ASMR, while the Philippines, Sao Tome and Principe, and Bangladesh had the highest ASDR. These patterns are rooted in structural inequities: low-SDI regions often lack robust healthcare infrastructure, face economic barriers to healthy diets, and have high prevalence of untreated metabolic conditions [61, 62]. Conversely, high-SDI regions, despite higher absolute consumption of processed foods and sedentary behaviors, benefit from advanced medical care and public health initiatives, leading to faster declines in ASMR/ASDR [63]. For instance, high-SDI nations have implemented sodium reduction policies, universal hypertension screening, and widespread statin use- interventions that remain scarce in LMICs [64, 65]. The rapid ASMR/ASDR declines in high-SDI settings demonstrate the potential of resource-backed interventions but also underscore the urgency of bridging global health inequities.
National-level variations reveal nuanced challenges. The dramatic rise in dietary risk-related ASMR in Oman, Qatar, and the United States- and ASDR in the U.S., UAE, and Bermuda- points to the unintended consequences of economic development and urbanization. In Gulf nations, rapid wealth accumulation has fueled dietary transitions toward energy-dense, processed foods, coupled with declining physical activity [66]. Similarly, the U.S. and Bermuda grapple with food environments dominated by ultra-processed products and systemic barriers to healthy eating in marginalized communities [67, 68]. For metabolic risks, Zimbabwe, Lesotho, and Turkmenistan experienced the steepest ASMR/ASDR increases, likely exacerbated by healthcare system collapses, political instability, and the double burden of malnutrition [69, 70]. Zimbabwe’s economic crisis, for example, has disrupted medication supply chains for chronic diseases, while Lesotho’s high HIV prevalence complicates metabolic health management [71, 72]. These examples emphasize that national context—economic policies, conflict, and health system resilience- profoundly shapes ICH trajectories.
Forecasting models paint a concerning picture. ARIMA projections suggest stable deaths and DALYs for dietary-related ICH but rising trends for metabolic-related cases through 2050. Exponential smoothing (ES) models predict slight increases in absolute metrics for both risk categories, albeit with declining ASMR/ASDR. The stability in dietary-related burden may reflect incremental successes in salt reduction programs and improved hypertension control globally [73]. However, the persistent rise in metabolic-related ICH aligns with unabated global trends in obesity and diabetes [22]. Even with declining standardized rates, population growth and aging will drive absolute increases, particularly in LMICs where metabolic risks are rising fastest. These projections underscore the limitations of current interventions: while age-standardized improvements are achievable, absolute burdens will escalate without transformative changes in food systems, urban planning, and healthcare access [74].
Addressing these challenges demands multifaceted strategies. For dietary risks, population-level sodium reduction remains paramount [75]. Countries like Japan and Finland have successfully implemented mandatory salt limits in processed foods, coupled with public education campaigns- a model adaptable to high-burden regions [76]. Subsidizing fruits, vegetables, and whole grains while taxing sugary drinks and ultra-processed foods could reshape dietary patterns, as evidenced by Mexico’s soda tax and South Africa’s sugar regulations [77]. Strengthening food labeling policies and restricting marketing of unhealthy foods to children are additional levers [78]. For metabolic risks, scaling up universal hypertension and diabetes screening is critical, particularly in primary care settings [79]. Task-shifting- training community health workers to manage chronic diseases- has proven effective in Rwanda and India, improving medication adherence and monitoring [80]. Digital health tools, such as mobile-based reminders for medication and telehealth consultations, could further enhance reach in remote areas [81].
This study’s limitations warrant consideration. First, reliance on GBD data introduces potential biases, as underreporting of ICH deaths is common in regions with weak vital registration systems. Misclassification between hemorrhagic and ischemic strokes may further skew estimates [82]. Second, dietary and metabolic risk assessments depend on population-level surveys, which may not capture individual-level heterogeneity or recent behavioral shifts. Third, the analysis does not fully account for interactions between multiple risk factors, such as synergies between high sodium intake and obesity. Finally, forecasting models cannot predict unprecedented societal changes- e.g., pandemics or economic collapses- that might alter risk trajectories.
In conclusion, while there have been reductions in age-standardized rates of ICH attributable to dietary and metabolic risks, the overall burden remains high. The findings highlight the need for continued efforts to address these modifiable risk factors, with a focus on high-burden regions and populations. Future research should explore the impact of specific interventions and policy changes on these trends to inform effective global strategies for ICH prevention and control.
Data Availability
Correspondence and requests for data should be addressed to Minghao Tang.
Conflicts of Interest
None.
REFERENCES
1. Valery L Feigin, Michael Brainin, Bo
Norrving, et al. “World Stroke Organization: Global Stroke Fact Sheet 2025.” Int J Stroke, vol. 20, no. 2, pp.
132-144, 2025. View at: Publisher
Site
| PubMed
2. Wendy C Ziai, J Ricardo Carhuapoma
“Intracerebral Hemorrhage.” Continuum
(Minneap Minn), vol. 24, no. 6, pp. 1603-1622, 2018. View at: Publisher
Site
| PubMed
3. Thomas Potter, Vasileios-Arsenios
Lioutas, Mauricio Tano, et al. “Cognitive Impairment After Intracerebral
Hemorrhage: A Systematic Review of Current Evidence and Knowledge Gaps.” Front Neurol, vol. 12, pp. 716632, 2021.
View at: Publisher Site | PubMed
4. R Fogelholm, M Nuutila, A L Vuorela
“Primary intracerebral haemorrhage in the Jyväskylä region, central Finland,
1985-89: incidence, case fatality rate, and functional outcome.” J Neurol Neurosurg Psychiatry, vol. 55,
no. 7, pp. 546-552, 1992. View at: Publisher Site | PubMed
5. David Haupenthal, Joji B Kuramatsu,
Bastian Volbers, et al. “Disability-Adjusted Life-Years Associated With
Intracerebral Hemorrhage and Secondary Injury.” JAMA Netw Open, vol. 4, no. 7, pp. e2115859, 2021. View at: Publisher
Site
| PubMed
6. Lexa K Murphy, Bruce E Compas,
Melissa C Gindville, et al. “Cognitive functioning over 2 years after
intracerebral hemorrhage in school-aged children.” Dev Med Child Neurol, vol. 59, no. 11, pp. 1146-1151, 2017. View
at: Publisher Site | PubMed
7. Valery L Feigin, Michael Brainin, Bo
Norrving, et al. “World Stroke Organization: Global Stroke Fact Sheet 2025.” Int J Stroke, vol. 20, no. 2, pp.
132-144, 2025. View at: Publisher
Site
| PubMed
8. A G Thrift, J J McNeil, A Forbes, et
al. “Risk Factors for Cerebral Hemorrhage in the Era of Well-Controlled
Hypertension. Melbourne Risk Factor Study (MERFS) Group” Stroke, vol. 27, no. 11, pp. 2020-2025, 1996. View at: Publisher
Site
| PubMed
9. Hannah Gardener, Tatjana Rundek,
Clinton B Wright, et al. “Dietary sodium and risk of stroke in the Northern
Manhattan study.” Stroke, vol. 43,
no. 5, pp. 1200-1205, 2012. View at: Publisher
Site
| PubMed
10. Paul K Whelton, Lawrence J Appel,
Ralph L Sacco, et al. “Sodium, blood pressure, and cardiovascular disease:
further evidence supporting the American Heart Association sodium reduction
recommendations.” Circulation, vol.
126, no. 24, pp. 2880-2889, 2012. View at: Publisher
Site
| PubMed
11. Arjun Seth, Yasmin Mossavar-Rahmani,
Victor Kamensky, et al. “Potassium intake and risk of stroke in women with
hypertension and nonhypertension in the Women's Health Initiative.” Stroke, vol. 45, no. 10, pp. 2874-2880,
2014. View at: Publisher Site | PubMed
12. Madeline Nieves-Cintrón, Arsalan U
Syed, Matthew A Nystoriak, et al. “Regulation of voltage-gated potassium
channels in vascular smooth muscle during hypertension and metabolic
disorders.” Microcirculation, vol.
25, no. 1, 2018. View at: Publisher Site | PubMed
13. Linda S Johnson, Nick Mattsson,
Ahmad Sajadieh, et al. “Serum Potassium Is Positively Associated With Stroke
and Mortality in the Large, Population-Based Malmö Preventive Project Cohort.” Stroke, vol. 48, no. 11, pp. 2973-2978,
2017. View at: Publisher Site | PubMed
14. Kailash Krishnan, Polly Scutt, Lisa
Woodhouse, et al. “Glyceryl Trinitrate for Acute Intracerebral Hemorrhage.” Stroke, vol. 47, no. 1, pp. 44-52, 2016.
View at: Publisher Site | PubMed
15. G-C Chen, D-B Lv, Z Pang, et al.
“Red and processed meat consumption and risk of stroke: a meta-analysis of
prospective cohort studies.” Eur J Clin
Nutr, vol. 67, no. 1, pp. 91-95, 2013. View at: Publisher Site | PubMed
16. James M May, Zhi-Chao Qu, Xia Li
“Nitrite generates an oxidant stress and increases nitric oxide in EA.hy926
endothelial cells.” Free Radic Res,
vol. 38, no. 6, pp. 581-589, 2004. View at: Publisher
Site
| PubMed
17. Maike Knorr, Michael Hausding,
Swenja Kröller-Schuhmacher, et al. “Nitroglycerin-induced endothelial
dysfunction and tolerance involve adverse phosphorylation and
S-Glutathionylation of endothelial nitric oxide synthase: beneficial effects of
therapy with the AT1 receptor blocker telmisartan.” Arterioscler Thromb Vasc Biol, vol. 31, no. 10, pp. 2223-2231,
2011. View at: Publisher Site | PubMed
18. Kevin A Harvey, Tyler Arnold,
Tamkeen Rasool, et al. “Trans-fatty acids induce pro-inflammatory responses and
endothelial cell dysfunction.” Br J Nutr,
vol. 99, no. 4, pp. 723-731, 2008. View at: Publisher
Site
| PubMed
19. Somaye Fatahi, Elnaz Daneshzad,
Hamed Kord-Varkaneh, et al. “Impact of Diets Rich in Whole Grains and Fruits
and Vegetables on Cardiovascular Risk Factors in Overweight and Obese Women: A
Randomized Clinical Feeding Trial.” J Am
Coll Nutr, vol. 37, no. 7, pp. 568-577, 2018. View at: Publisher
Site
| PubMed
20. Guang Zhao, Yuyang Chen, Yuting Gu,
et al. “The clinical value of nutritional and inflammatory indicators in
predicting pneumonia among patients with intracerebral hemorrhage.” Sci Rep, vol. 14, no. 1, pp. 16171,
2024. View at: Publisher Site | PubMed
21. Yan Zhang, Suliman Khan, Yang Liu,
et al. “Oxidative Stress Following Intracerebral Hemorrhage: From Molecular
Mechanisms to Therapeutic Targets.” Front
Immunol, vol. 13, pp. 847246, 2022. View at: Publisher
Site
| PubMed
22. Yung Ki Park, Hyeong-Joong Yi, Young
Jun Lee, et al. “The relationship between metabolic syndrome (MetS) and
spontaneous intracerebral hemorrhage (ICH).” Neurol Sci, vol. 34, no. 9, pp. 1523-1528, 2013. View at: Publisher
Site
| PubMed
23. Xiang-Hua Ye, Jian-Li Zhang, Yu-Jia
Jin, et al. “Association Between Insulin Resistance and Remote
Diffusion-Weighted Imaging Lesions in Primary Intracerebral Hemorrhage.” Front Immunol, vol. 12, pp. 719462,
2021. View at: Publisher Site | PubMed
24. Juan F Arenillas, María A Moro,
Antoni Dávalos “The metabolic syndrome and stroke: potential treatment
approaches.” Stroke, vol. 38, no. 7,
pp. 2196-2203, 2007. View at: Publisher
Site
| PubMed
25. Benedetta Maria Bonora,
Mariacristina Marescotti, Giorgio Marcuzzo, et al. “Synergistic interactions
among metabolic syndrome components and homeostasis model assessment of insulin
resistance in a middle-aged general population over time.” Metab Syndr Relat Disord, vol. 13, no. 4, pp. 171-178, 2015. View
at: Publisher Site | PubMed
26. Paulo W Pires, Carla M Dams Ramos,
Nusrat Matin, et al. “The effects of hypertension on the cerebral circulation.”
Am J Physiol Heart Circ Physiol, vol.
304, no. 12, pp. H1598-H1614, 2013. View at: Publisher
Site
| PubMed
27. Jeong-a Kim, Monica Montagnani,
Kwang Kon Koh, et al. “Reciprocal relationships between insulin resistance and
endothelial dysfunction: molecular and pathophysiological mechanisms.” Circulation, vol. 113, no. 15, pp.
1888-1904, 2006. View at: Publisher
Site
| PubMed
28. Yoichi Miura, Hidenori Suzuki
“Dyslipidemia and atherosclerotic carotid artery stenosis.” Vessel Plus, vol. 3, pp. 1, 2019. View
at: Publisher Site
29. Alin Stirban, Thomas Gawlowski,
Michael Roden “Vascular effects of advanced glycation endproducts: Clinical
effects and molecular mechanisms.” Mol
Metab, vol. 3, pp. 2, pp. 94-108, 2013. View at: Publisher
Site
| PubMed
30. Jeongmin Lee, Jae-Seung Yun,
Seung-Hyun Ko “Advanced Glycation End Products and Their Effect on Vascular
Complications in Type 2 Diabetes Mellitus.” Nutrients,
vol. 14, no. 15, pp. 3086, 2022. View at: Publisher Site | PubMed
31. Burton E Sobel “Fibrinolysis and
diabetes.” Front Biosci, vol. 8, pp.
d1085-1092, 2003. View at: Publisher Site | PubMed
32. T Brott, K Thalinger, V Hertzberg
“Hypertension as a risk factor for spontaneous intracerebral hemorrhage.” Stroke, vol. 17, no. 6, pp. 1078-1083,
1986. View at: Publisher Site | PubMed
33. Teresa T Fung, Meir J Stampfer,
JoAnn E Manson, et al. “Prospective Study of Major Dietary Patterns and Stroke
Risk in Women.” Stroke, vol. 35, no.
9, pp. 2014-2019, 2004. View at: Publisher
Site
| PubMed
34. GBD 2021 Risk Factors Collaborators
“Global burden and strength of evidence for 88 risk factors in 204 countries
and 811 subnational locations, 1990-2021: a systematic analysis for the Global
Burden of Disease Study 2021.” Lancet,
vol. 403, no. 10440, pp. 2162-2203, 2024. View at: Publisher
Site
| PubMed
35. GBD 2021 Diseases and Injuries
Collaborators “Global incidence, prevalence, years lived with disability
(YLDs), disability-adjusted life-years (DALYs), and healthy life expectancy
(HALE) for 371 diseases and injuries in 204 countries and territories and 811
subnational locations, 1990-2021: a systematic analysis for the Global Burden
of Disease Study 2021.” Lancet, vol.
403, no. 10440, pp. 2133-2161, 2024. View at: Publisher
Site
| PubMed
36. Min Zhang, Linlin Yuan, Meimei Cui,
et al. “Analysis the Burden of Breast Cancer Among Adolescents and Young Adults
Using the Global Burden of Disease 2021.” Ann
Surg Oncol, vol. 32, no. 3, pp. 2056-2069, 2025. View at: Publisher
Site
| PubMed
37. GBD 2021 Causes of Death
Collaborators “Global burden of 288 causes of death and life expectancy
decomposition in 204 countries and territories and 811 subnational locations,
1990-2021: a systematic analysis for the Global Burden of Disease Study 2021.” Lancet, vol. 403, no. 10440, pp.
2100-2132, 2024. View at: Publisher
Site
| PubMed
38. Jing Zhang, Bing Ma, Xu Han, et al.
“Global, regional, and national burdens of HIV and other sexually transmitted
infections in adolescents and young adults aged 10-24 years from 1990 to 2019:
a trend analysis based on the Global Burden of Disease Study 2019.” Lancet Child Adolesc Health, vol. 6, no.
11, pp. 763-776, 2022. View at: Publisher
Site
| PubMed
39. Hao Zi, Shao-Hua He, Xie-Yuan Leng,
et al. “Global, regional, and national burden of kidney, bladder, and prostate
cancers and their attributable risk factors, 1990-2019.” Mil Med Res, vol. 8, no. 1, pp. 60, 2021. View at: Publisher
Site
| PubMed
40. Ahmad Reza Hosseinpoor, Nicole
Bergen, Katherine Kirkby, et al. “Strengthening and expanding health inequality
monitoring for the advancement of health equity: a review of WHO resources and
contributions.” Int J Equity Health,
vol. 22, no. 1, pp. 49, 2023. View at: Publisher
Site
| PubMed
41. Tingfen Han, Tingting Wang, Yuping
Ye, et al. “The global, regional, and national burden of paralytic ileus and
intestinal obstruction, 1990 to 2021: a cross-sectional analysis from the 2021
global burden of disease study.” Int J
Surg, vol. 111, no. 2, pp. 1773-1787, 2025. View at: Publisher
Site
| PubMed
42. Jieyu Peng, Huan Xu, Xiaowei Tang
“Global Inequalities in the Burden of Digestive Diseases From 1990 to 2019:
Findings From the Global Burden of Disease Study 2019.” Gastroenterology, vol. 166, no. 1, pp. 223-224.e1, 2024. View at: Publisher
Site
| PubMed
43. Pedro Ordunez, Ramon Martinez,
Patricia Soliz, et al. “Rheumatic heart disease burden, trends, and
inequalities in the Americas, 1990-2017: a population-based study.” Lancet Glob Health, vol. 7, no. 10, pp.
e1388-e1397, 2019. View at: Publisher
Site
| PubMed
44. Pengyu Huang, Jie Zhang “Global
leukemia burden and trends: a comprehensive analysis of temporal and spatial
variations from 1990-2021 using GBD (Global Burden of Disease) data.” BMC Public Health, vol. 25, no. 1, pp.
262, 2025. View at: Publisher Site | PubMed
45. Wen Xie, Aiping Li, Yao Zhang, et
al. “Global burden of stroke attributable to dietary risk factors in the GBD
2021 study.” Front Nutr, vol. 11, pp.
1494574, 2024. View at: Publisher
Site
| PubMed
46. Zhao-Wei Wang, Mei-Ping Wan, Jia-Hui
Tai, et al. “Global regional and national burden of intracerebral hemorrhage
between 1990 and 2021.” Sci Rep, vol.
15, no. 1, pp. 3624, 2025. View at: Publisher
Site
| PubMed
47. W Haomiao Wang, Jinxin Lin, Long Wang,
et al. “Global, Regional, and National Burden of Intracerebral Hemorrhage in
Young Adults From 1990 to 2021: A Population‐Based Study.” J Am Heart Assoc, vol. 13,
no. 21, pp. e037286, 2024. View at: Publisher
Site
| PubMed
48. Hemorrhagic Stroke Academia Industry
(HEADS) Roundtable Participants “Unmet Needs and Challenges in Clinical
Research of Intracerebral Hemorrhage.” Stroke,
vol. 49, no. 5, pp. 1299-1307, 2018. View at: Publisher
Site
| PubMed
49. Susanna M Zuurbier, Alejandro N
Santos, Kelly D Flemming, et al. “Female Hormone Therapy and Risk of
Intracranial Hemorrhage From Cerebral Cavernous Malformations: A Multicenter
Observational Cohort Study.” Neurology,
vol. 100, no. 16, pp. e1673-e1679, 2023. View at: Publisher
Site
| PubMed
50. Yoshiteru Tada, Kosuke Wada, Kenji
Shimada, et al. “Estrogen protects against intracranial aneurysm rupture in
ovariectomized mice.” Hypertension,
vol. 63, no. 6, pp. 1339-1344, 2014. View at: Publisher
Site
| PubMed
51. Priscilla Abrafi Opare-Addo, Fred
Stephen Sarfo, Bruce Ovbiagele “Role of Nutritional Epigenetics for
Cerebrovascular Health in Low- and Middle-Income Countries.” J Am Heart Assoc, vol. 14, no. 2, pp.
e035984, 2025. View at: Publisher
Site
| PubMed
52. Nasheeta Peer, Debbie Bradshaw, Ria
Laubscher, et al. “Urban-rural and gender differences in tobacco and alcohol
use, diet and physical activity among young black South Africans between 1998
and 2003.” Glob Health Action, vol.
6, pp. 19216, 2013. View at: Publisher
Site
| PubMed
53. Munyoung Yang, Hyoungseob Yoo,
Seo-Young Kim, et al. “Occupational Risk Factors for Stroke: A Comprehensive
Review.” J Stroke, vol. 25, no. 3,
pp. 327-337, 2023. View at: Publisher
Site
| PubMed
54. Alessandra Feraco, Andrea Armani,
Stefania Gorini, et al. “Gender Differences in Dietary Patterns and Eating
Behaviours in Individuals with Obesity.” Nutrients,
vol. 16, no. 23, pp. 4226, 2024. View at: Publisher Site | PubMed
55. D A Dulli, P L Remington, R L
Levine, et al. “Relationship between age and mortality due to intracerebral
versus subarachnoid hemorrhage.” J Stroke
Cerebrovasc Dis, vol. 6, no. 6, pp. 416-420, 1997. View at: Publisher
Site
| PubMed
56. Corinna Koebnick, Giuseppina
Imperatore, Elizabeth T Jensen, et al. “Progression to hypertension in youth
and young adults with type 1 or type 2 diabetes: The SEARCH for Diabetes in
Youth Study.” J Clin Hypertens
(Greenwich), vol. 22, no. 5, pp. 888-896, 2020. View at: Publisher Site | PubMed
57. Julia Steinberger, Stephen R Daniels
“Obesity, insulin resistance, diabetes, and cardiovascular risk in children: an
American Heart Association scientific statement from the Atherosclerosis,
Hypertension, and Obesity in the Young Committee (Council on Cardiovascular
Disease in the Young) and the Diabetes Committee (Council on Nutrition,
Physical Activity, and Metabolism).” Circulation,
vol. 107, no. 10, pp. 1448-1453, 2003. View at: Publisher
Site
| PubMed
58. Johnathan D Tune, Adam G Goodwill,
Daniel J Sassoon “Cardiovascular consequences of metabolic syndrome.” Transl Res, vol. 183, pp. 57-70, 2017.
View at: Publisher Site | PubMed
59. M Mohsen Ibrahim “Hypertension in
Developing Countries: A Major Challenge for the Future.” Curr Hypertens Rep, vol. 20, no. 5, pp. 38, 2018. View at: Publisher
Site
| PubMed
60. Bharati V Mittal, Ajay K Singh
“Hypertension in the developing world: challenges and opportunities.” Am J Kidney Dis, vol. 55, no. 3, pp.
590-598, 2010. View at: Publisher
Site
| PubMed
61. Derek D Headey, Olivier Ecker,
Andrew R Comstock, et al. “Poverty, price and preference barriers to improving
diets in sub-Saharan Africa.” Glob Food
Sec, vol. 36, pp. 100664, 2023. View at: Publisher
Site
| PubMed
62. Zihao Bai, Jingru Han, Jia An, et
al. “The global, regional, and national patterns of change in the burden of
congenital birth defects, 1990-2021: an analysis of the global burden of
disease study 2021 and forecast to 2040.” EClinicalMedicine,
vol. 77, pp. 102873, 2024. View at: Publisher
Site
| PubMed
63. Chuan He, Saien Lu, Haijie Yu, et
al. “Global, regional, and national disease burden attributable to high
systolic blood pressure in youth and young adults: 2021 Global Burden of
Disease Study analysis.” BMC Med,
vol. 23, no. 1, pp. 74, 2025. View at: Publisher
Site
| PubMed
64. Keke Wang, Yaqiong Jin, Mengxiao
Wang, et al. “Global cardiovascular diseases burden attributable to high sodium
intake from 1990 to 2019.” J Clin
Hypertens (Greenwich), vol. 25, no. 9, pp. 868-879, 2023. View at: Publisher Site | PubMed
65. Aletta E Schutte, Nikhil
Srinivasapura Venkateshmurthy, Sailesh Mohan, et al. “Hypertension in Low- and
Middle-Income Countries.” Circ Res,
vol. 128, no. 7, pp. 808-826, 2021. View at: Publisher
Site
| PubMed
66. Abdulrahman O Musaiger, Hamed R
Takruri, Abdelmonem S Hassan, et al. “Food-based dietary guidelines for the
arab gulf countries.” J Nutr Metab,
vol. 2012, pp. 905303, 2012. View at: Publisher Site | PubMed
67. Aparna Katre, Brianna Raddatz
“Low-Income Families' Direct Participation in Food-Systems Innovation to
Promote Healthy Food Behaviors.” Nutrients,
vol. 15, no. 5, pp. 1271, 2023. View at: Publisher Site | PubMed
68. Filippa Juul, Niyati Parekh,
Euridice Martinez-Steele, et al. “Ultra-processed food consumption among US
adults from 2001 to 2018.” Am J Clin Nutr,
vol. 115, no. 1, pp. 211-221, 2022. View at: Publisher Site | PubMed
69. Stein Emil Vollset, Hazim S Ababneh,
Yohannes Habtegiorgis Abate, et al. “Burden of disease scenarios for 204
countries and territories, 2022-2050: a forecasting analysis for the Global
Burden of Disease Study 2021.” Lancet,
vol. 403, no. 10440, pp. 2204-2256, 2024. View at: Publisher
Site
| PubMed
70. Junjie Huang, Veeleah Lok, Chun Ho
Ngai, et al. “Disease Burden, Risk Factors, and Recent Trends of Liver Cancer:
A Global Country-Level Analysis.” Liver
Cancer, vol. 10, no. 4, pp. 330-345, 2021. View at: Publisher Site | PubMed
71. Motlalepula Sebilo, Neo R T
Ledibane, Simbarashe Takuva “Incidence of cardiometabolic diseases in a Lesotho
HIV cohort: Evidence for policy decision-making.” South Afr J HIV Med, vol. 22, no. 1, pp. 1246, 2021. View at: Publisher
Site
| PubMed
72. Tatenda T Yemeke, Farouk A Umaru,
Rashida A Ferrand, et al. “Impact of the COVID-19 Pandemic on Medical Product
Procurement, Prices, and Supply Chain in Zimbabwe: Lessons for Supply Chain
Resiliency.” Glob Health Sci Pract,
vol. 11, no. 5, pp, e2200424, 2023. View at: Publisher
Site
| PubMed
73. Daniel Lemogoum “Challenge for
hypertension prevention and control worldwide: the time for action.” J Clin Hypertens (Greenwich), vol. 16,
no. 8, pp. 554-556, 2014. View at: Publisher Site | PubMed
74. Hugh Barton, Marcus Grant “Urban
planning for healthy cities. A review of the progress of the European Healthy
Cities Programme.” J Urban Health,
vol. 90 Suppl 1, no. Suppl 1, pp. 129-141, 2013. View at: Publisher
Site
| PubMed
75. Nicole Ide, Adefunke Ajenikoko,
Lindsay Steele, et al. “Priority Actions to Advance Population Sodium
Reduction.” Nutrients, vol. 12, no.
9, pp. 2543, 2020. View at: Publisher Site | PubMed
76. Nayu Ikeda, Hitomi Yamashita, Jun
Hattori, et al. “Economic effects of dietary salt reduction policies for
cardiovascular disease prevention in Japan: a simulation study of hypothetical
scenarios.” Front Nutr, vol. 10, pp.
1227303, 2023. View at: Publisher
Site
| PubMed
77. Juan Carlos Salgado Hernández, Ana
Basto-Abreu, Isabel Junquera-Badilla, et al. “Building upon the sugar beverage
tax in Mexico: a modelling study of tax alternatives to increase benefits.” BMJ Glob Health, vol. 8, no. Suppl 8,
pp. e012227, 2023. View at: Publisher
Site
| PubMed
78. Emma Boyland, Lauren McGale,
Michelle Maden, et al. “Systematic review of the effect of policies to restrict
the marketing of foods and non-alcoholic beverages to which children are
exposed.” Obes Rev, vol. 23, no. 8,
pp. e13447, 2022. View at: Publisher Site | PubMed
79. Gunjeet Kaur, Akashdeep Singh
Chauhan, Shankar Prinja, et al. “Cost-effectiveness of population-based
screening for diabetes and hypertension in India: an economic modelling study.”
Lancet Public Health, vol. 7, no. 1,
pp. e65-e73, 2022. View at: Publisher
Site
| PubMed
80. Patrick M Newman, Molly F Franke,
Jafet Arrieta, et al. “Community health workers improve disease control and
medication adherence among patients with diabetes and/or hypertension in
Chiapas, Mexico: an observational stepped-wedge study.” BMJ Glob Health, vol. 3, no. 1, pp. e000566, 2018. View at: Publisher
Site
| PubMed
81. Supriya Mathew, Michelle S Fitts,
Zania Liddle, et al. “Telehealth in remote Australia: a supplementary tool or
an alternative model of care replacing face-to-face consultations?” BMC Health Serv Res, vol. 23, no. 1, pp.
341, 2023. View at: Publisher Site | PubMed
82. Jiahui
Fan, Xiaoguang Li, Xueying Yu, et al. “Global Burden, Risk Factor Analysis, and
Prediction Study of Ischemic Stroke, 1990-2030.” Neurology, vol. 101, no. 2, pp. e137-e150, 2023. View at: Publisher Site | PubMed